Black Lives Matter
As we are called to action by our state chancellor, our college president, and our colleagues (AASA Call to action, Latnix letter of support), it is critical to reflect on our own personal and professional actions with regard to racism, and make our own personal commitments to combating racisim in ourselves and in our work. We must also address systemic and institutional racism.
What is systemic or institutional racism? How does it happen? This is, of course, complex. Our systems and institutions are made up of multiple people and all kinds of procedures, policies, and practices that build up over time to create the outcomes.
We can identify systemic racism by seeing that the outcomes are racialized. When we disaggregate the data, we see that our system produces different outcomes for different racial and demographic groups.
Our CA community college system, our district, and our college itself has actually been analyzing data in this way for many years. Recently, I’ve been spotlighting some of that data and pointing out sources for your own individual exploration in a section of the ASC President blogs I labeled with the term “equity”. Right now is the perfect time to begin to engage with this data if you have not before, or to re-visit it and dig in deeper.
Please take a look at this information. It is re-published below. The data reflects you and your work whether you like it or not, because you are an integral part of this system! Changing these systems that produced these outcomes is the work ahead, and it won’t be easy.
I look forward to making change with you, and share the goal of racial equity noted as defined by the City of Richmond’s GARE alliance, “We eliminate racial disproportionalities so that race can no longer be used to predict success, and we increase the success of all communities.”
12/2/2019 : who are our students, who are we?
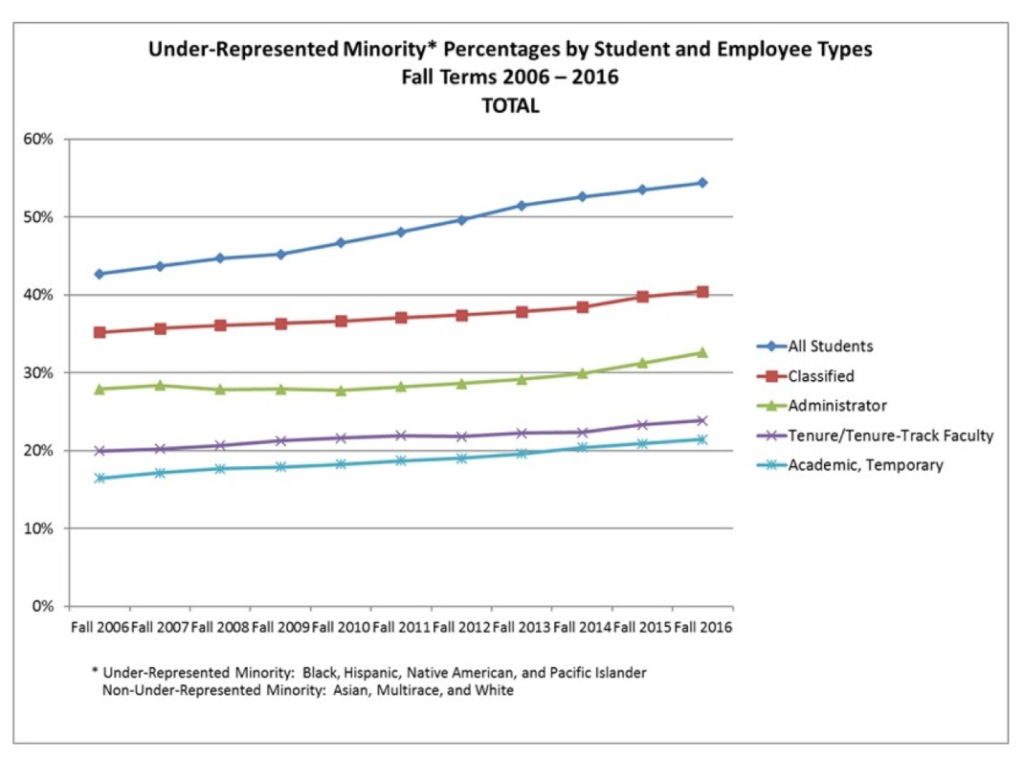
Equity information: I’d like to share interesting equity-related data each time I post a blog. I recently attended the ASCCC Fall plenary, and this graph was presented at both the general session and a breakout session I attended. Note that student diversity at California Community Colleges vasty surpasses faculty diversity.
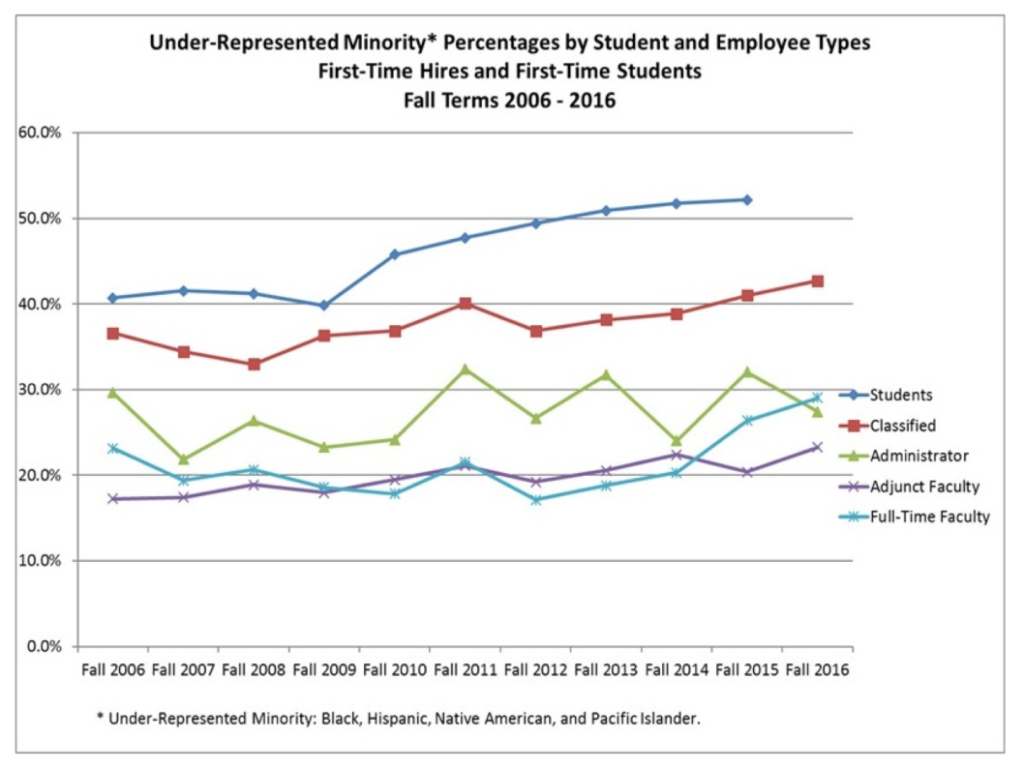
This related figure was presented only at the breakout. It shows NEW ARRIVALS on campuses across California, rather than the total population of each group . The student trend is similar, to the graphic above as students tend to stay on campuses only a few years. Notice how the full-time faculty trend differs, though.
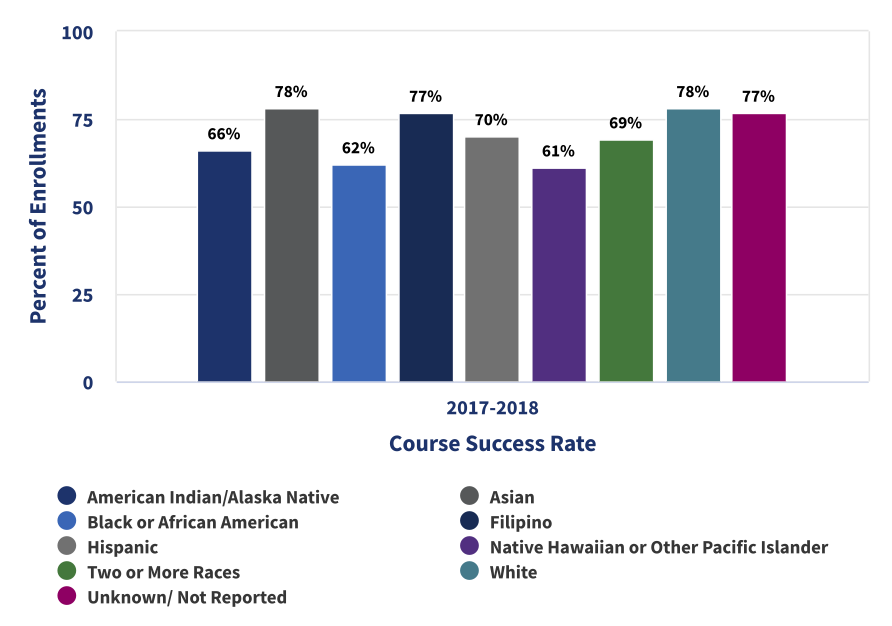
12/20/19: one year of disaggregated course success rates at CCC
2/3/20: guided pathways metrics for CCC
Number of credits earned in a year (not semester) by CCC students. % full time students at CCC (by ethnicity)
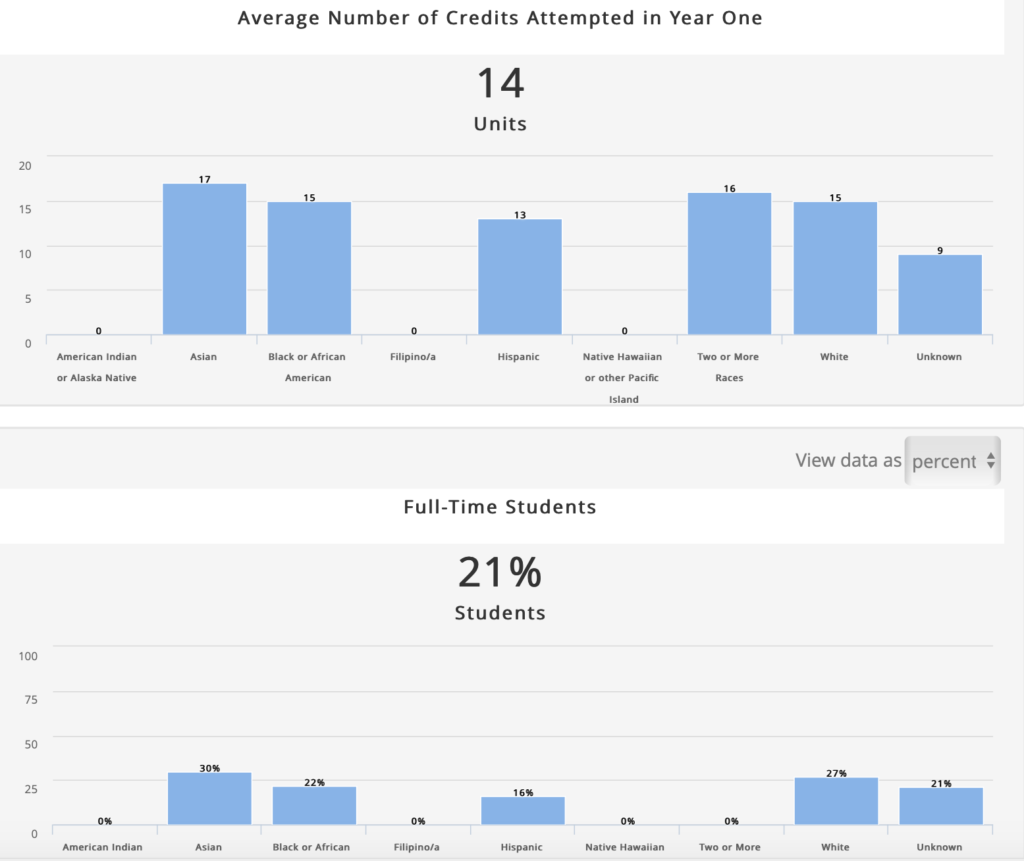
then “data”, then “Launchboard”, then “guided pathways”. (This gets you here) Leave the ‘first time ever in college’ button selected, Select CCC on the left menu and 2015-2016 then “run report” button. After results are generated, drill down by “ethnicity” in the center pull down menu.
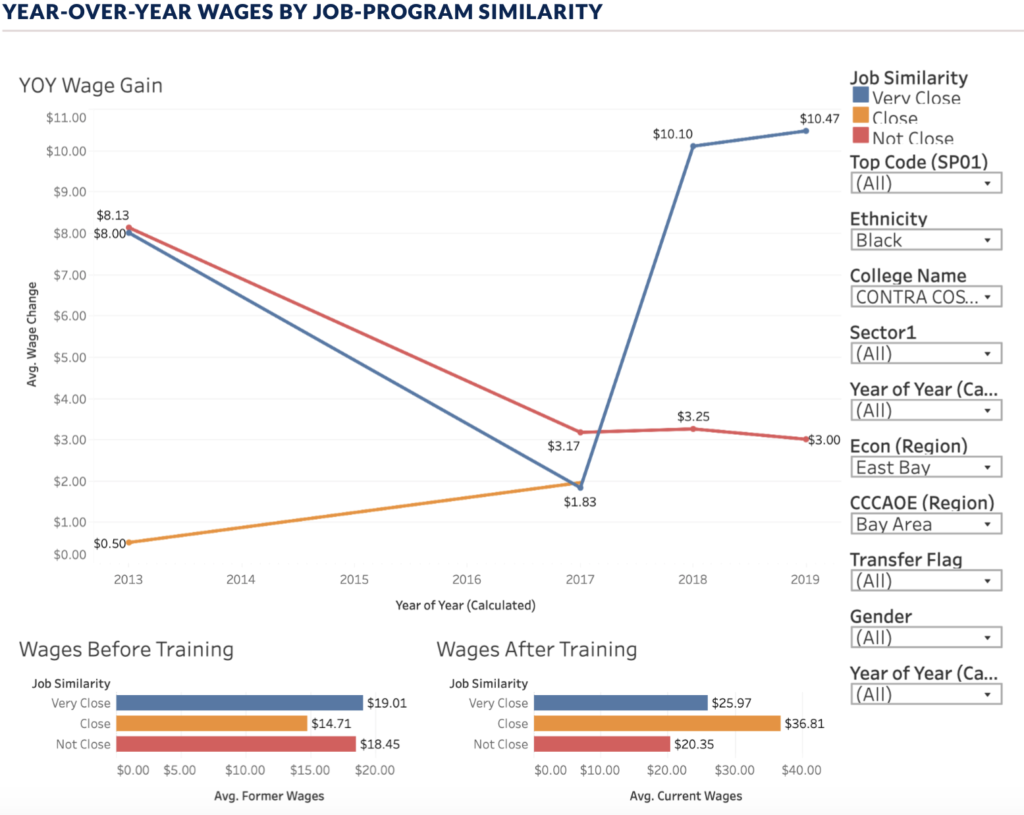
2/10/20: CTE outcomes data
Speaking of CCCCO data, here’s something to consider this week. These are graphs generated from the CTE outcomes survey data: Black student data from CCC is on the top, White student data in the middle, and Hispanic/Latinx student data on the bottom. This analysis requires additional scrutiny, but at first glance, I see that black student wage gains were less than white students’ in 2018 after taking courses at CCC (compare the blue lines of the graphs in the top and middle panel).
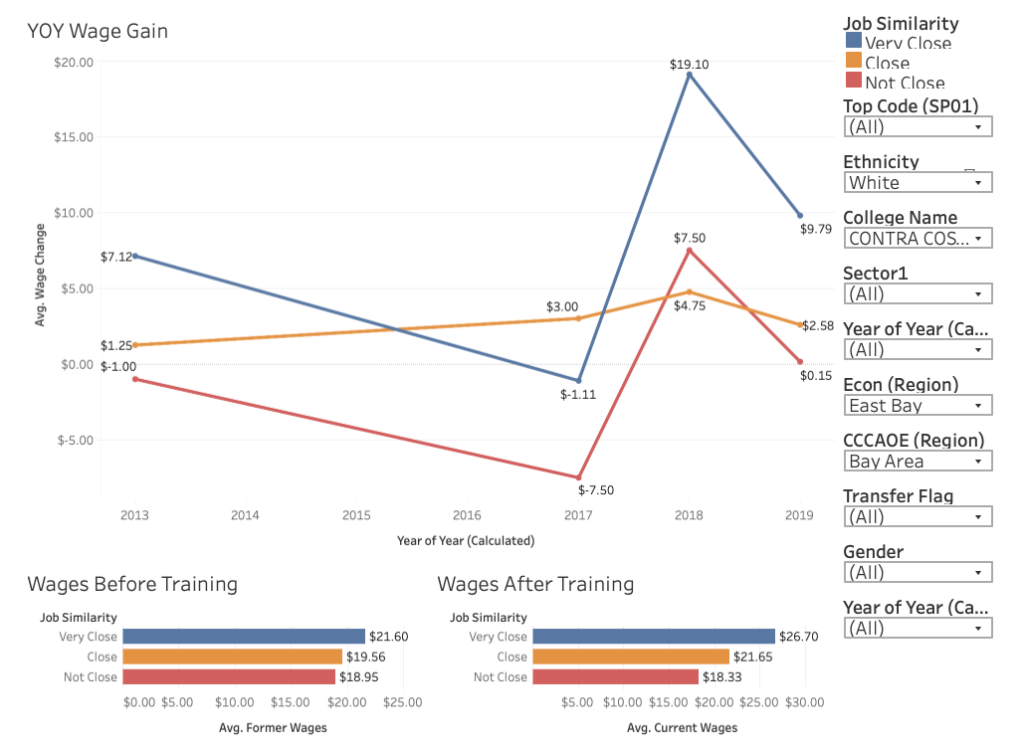
Over the whole period (2013-2018), however, it looks like black student wages might be higher than white students after CCC coursework (compare bar graphs between panels). It also seems that white students saw larger wage gains from CCC job training than hispanic/latino students in 2018 (compare blue line graphs between the middle and lower panels) and that white students started off with higher salaries before coming to CCC than Hispanic/Latinx students (compare bar graphs between the middle and lower panel).
BLACK student data
WHITE student data
LATINX/HISPANIC student data
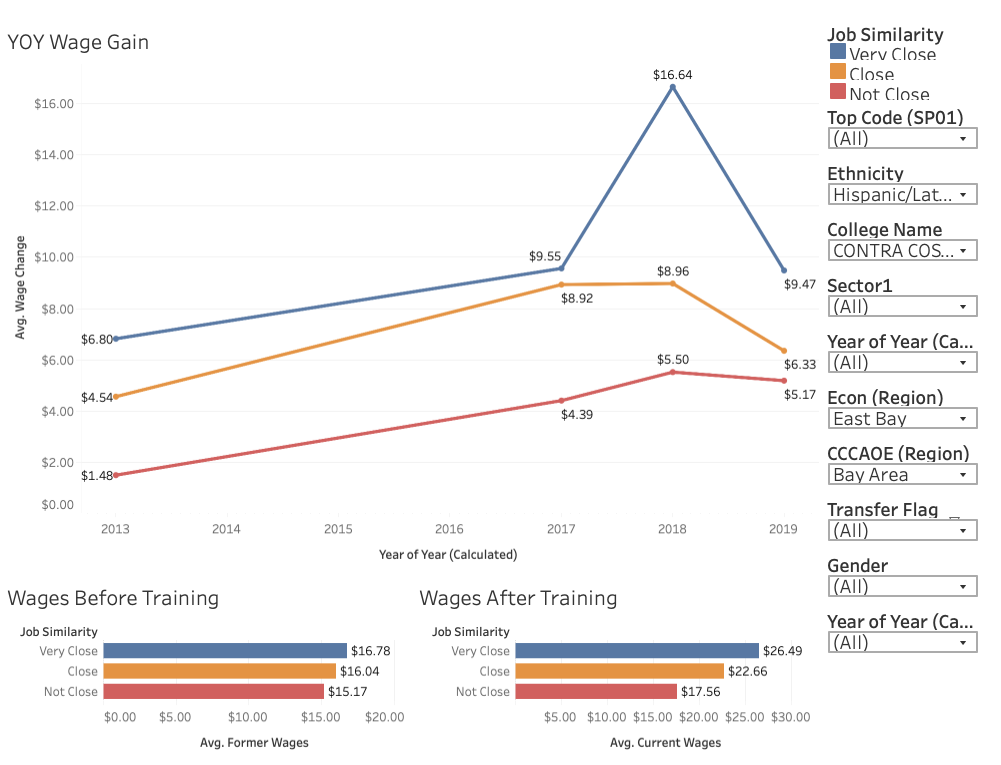
To visualize your own versions of this data start here: https://www.cccco.edu/ choose “College Professionals”, then “data”, scroll down to “CTE Outcomes Survey”, Scroll down to 2019 visualizations, choose “year-over-year wages by job-program similarity”. TOP code (all), Ethnicity (first Black, then a 2nd graph with White, then a 3rd with Hispanic/Latinx), College (contra costa), sector (all), year of year (all), Econ region (east bay). Cccaoe region (Bay Area), transfer (all), Gender (all), year of year (all).
2/19/20: our strategic plan, accreditation and equity
The ISER is a document that’s supposed to describe the structures and processes that help our college run according to the accreditation standards and show evidence that CCC is following them. A draft is available now so take a look! You’ll notice that some areas aren’t complete and still lack evidence. If you have input to provide, please contact one of your ASC representatives (listed on agendas and minutes), as we are discussing this at the March 2 ASC meeting.
How do we “prove” our structures and processes are functioning? Well, one big source is committee minutes. I’ll attest that we have a lot of minutes publicly available, but it takes some commitment to read through them and find good examples. No matter what, we should all be able to talk about how we see ourselves and our work in this document by October when the accreditation team visits! Do keep an eye out for Dr. Padilla’s requests for contributions to the project!
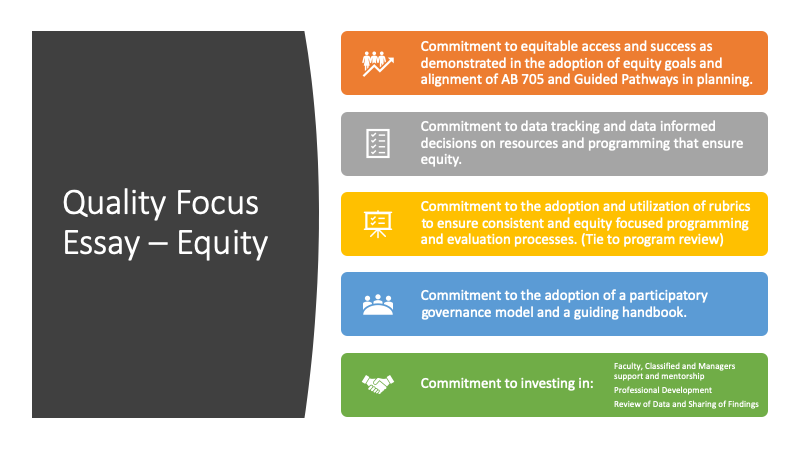
The QFE (quality focused essay) describes something the college chooses to highlight. The college also commits to providing evidence of improvement in the next couple of years. The current topic chosen by the Accreditation Steering Committee is Equity, with specific examples related to equity goals and alignment in planning with AB705 and Guided Pathways.
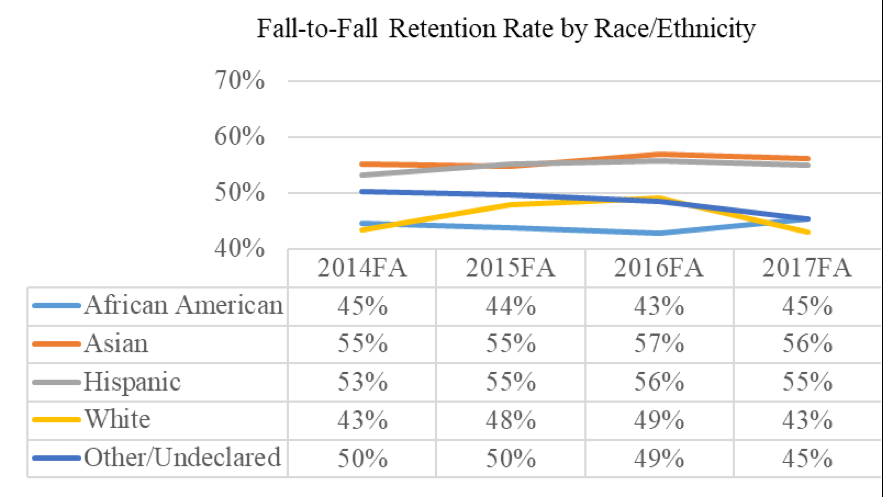
2/26/20: retention rates by ethnicity at CCC from our ISER
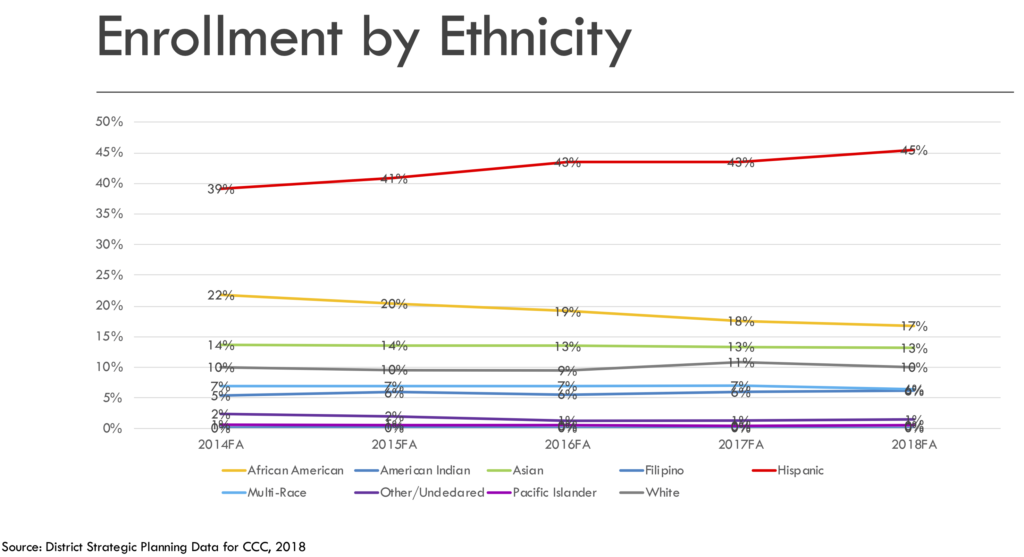
3/3/20: enrollment at CCC by ethnicity from our strategic plan